Hi,
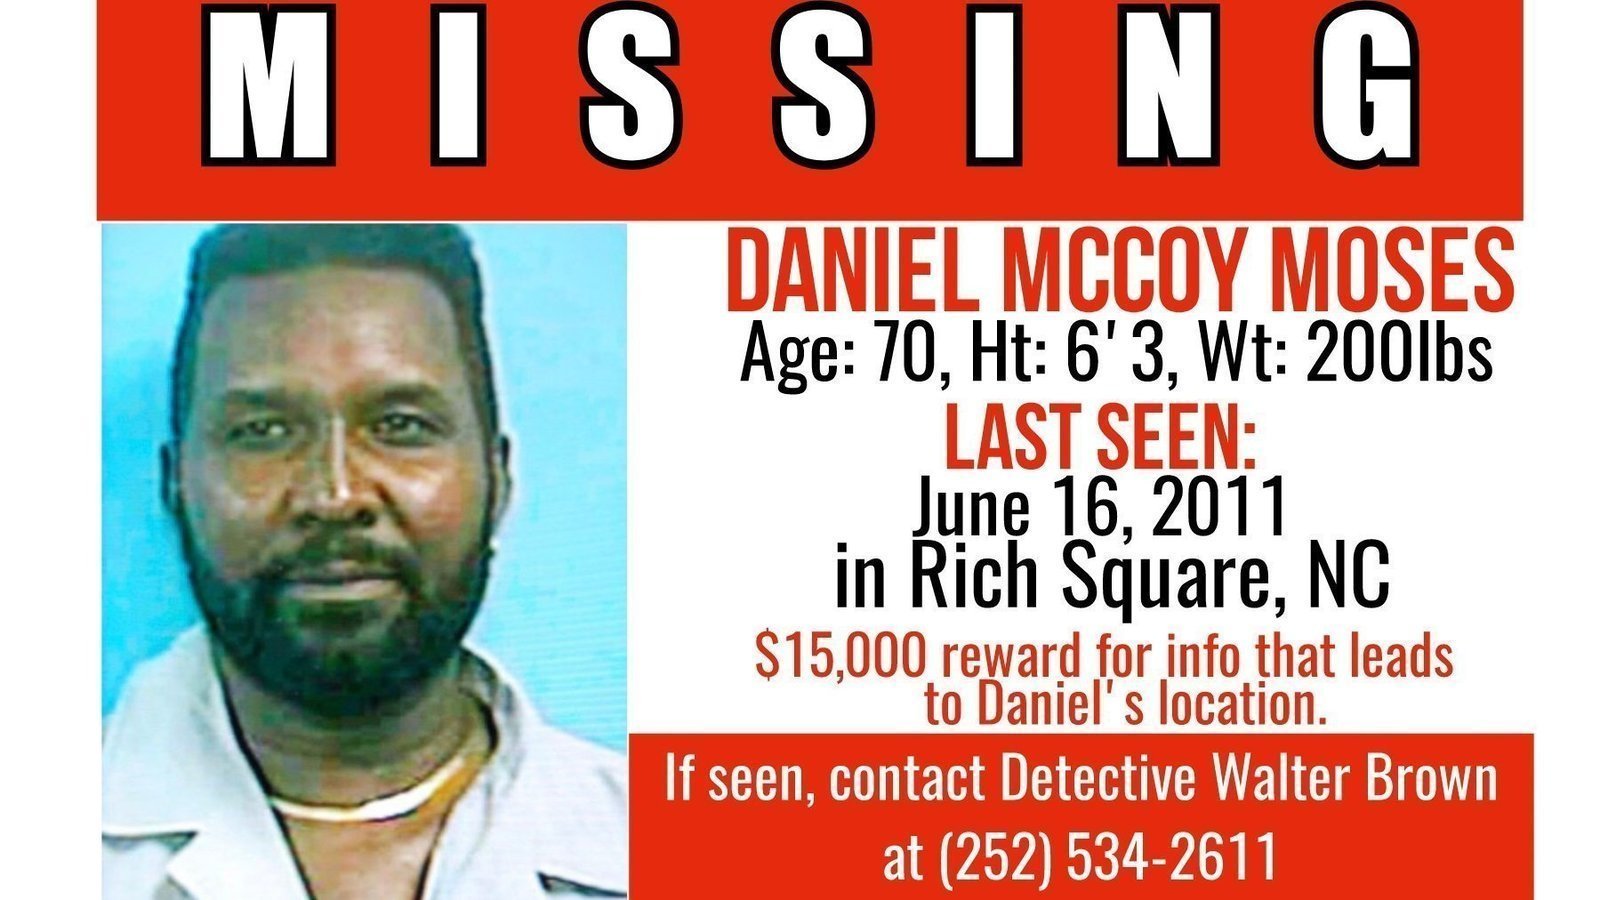
First, I'm so sorry that Daniel Moses has been missing for so many years. I heard about his case from the "Unsolved Mysteries" podcast.
I'm sure after so many years, the authorities have done exhaustive searches for Daniel and any contribution I could make would already have been explored by others. That said, I have a bit of data analysis I can share. This post will probably be a bit long.
Context
The SBI and local authorities have searched the woods and area around Daniel's home many times, so there's some reason to believe that area is of interest. Any available information about changes to that area after Daniel's disappearance may aid in locating him if he's there.
About Me
Normally, I wouldn't lead with this, but I'd like to share my expertise. I'm a PhD candidate in Geography, specifically focused on remote sensing of land cover, land use, and other changes. That's a fancy way of saying I'm an expert at image analysis from drones, aircraft, satellites, etc., and I'm reasonably skilled at mapping.
Data Availability and Analysis
The National Agricultural Imagery Program (NAIP) is a US-funded collection of imagery across most of the US, and occurs semi-regularly (every few years). In Rehoboth, NC, this imagery was collected in June 2010 and June 2012 (1 year before, and 1 year after, Daniel's disappearance). The imagery has some interesting properties 1) it is too coarse for seeing individual people as it's about 3 feet per pixel, and 2) it includes visible color (red, green, blue) and near-infrared information. This means that, while the imagery would not be useful for directly locating a person, it would be useful for finding places where the vegetation health, quality, ground surface, and landscape have changed. For example, if a grave were dug, or concrete poured, vegetation cut, etc., it might be useful for identifying the locations of those changes.
Another possibility, though scientifically untested, is that (I'm sorry for this) a decaying body may have a significant impact on vegetation in the direct vicinity (initial decrease in vegetation health due to increased nitrogen in the soil, followed eventually by an increase in the vegetation health). There are researchers at the University of Tennessee's Forensic Anthropology Department who are studying this but I was not able to locate any published papers on their findings. Given the availability of the NAIP imagery, they might be a resource for you to reach out to, as they may be able to do a better job of analysis on this topic than I could.
What I've done is put together a web map with the following layers:
- NAIP 2010 Imagery
- NAIP 2020 Imagery
- Changes between 2010 and 2012
- dark blue generally means more red reflectance, less near-infrared reflectance (reduced vegetation health)
- light green generally means less red reflectance, more near-infrared reflectance (increased vegetation)
- Changes between 2010 and 2012 Relabeled
- dark blue generally means more red reflectance, less near-infrared reflectance (reduced vegetation health)
- Red generally means less red reflectance, more near-infrared reflectance (increased vegetation health)
The web map can be viewed here (until August 9th, 2022 when my free access to store the map goes away):
GIS Cloud Map Portal - Missing Person: Daniel Moses
To use the map, you can zoom in and out with a mouse scroll wheel. In a box on the left of the map, you can "Check" and "Uncheck" the layers to show. Layers higher-up on the list block the layers lower on the list... My suggestion is to only have 1 layer checked at a time (expect the changes_imagery_relabeled layer, which I added some transparency to).
Limitations and How to Use the Map Data
As I noted, it's impossible with the NAIP imagery to make out individual people. Additionally, over 2 years, a LOT can change in an area, and most or all of the changes are likely to be irrelevant to helping with this case. However, here's a tip that could help make this information more useful:
- In the changes_imagery_relabeled layer, red and blue pixels in groups of 5 connected pixels or fewer would probably be the most likely to be helpful in finding relevant changes related to this case. This is because (hypothetically and untested) the impact of a single body on the surrounding vegetation would be limited in area.
- The map could be useful in narrowing search areas or targeting new search areas near Daniel's home.
Finally, the web map is a temporary way for me to share the map data on the off chance that it is helpful to anyone still conducting area searches. I'd be happy to provide the actual GIS files to interested (and qualified?) people who have GIS experience. I also may be able to spend some time creating a similar set of map data for another location (Virginia was mentioned) if a general search area / area of interest is provided.
Best wishes.