Coronavirus COVID-19 - Global Health Pandemic #84

Status
Not open for further replies.
Perhaps. But if a person is now working from a home they own, on which they pay a mortgage, that is not the case. Many, many homeowning, middle class workers are now working from home (and many of us had to buy things to do that).

We weren't talking about most people - we were talking about those of us whose employers require us to work from home.

Here's a Forbes article that explains the change:

"In past years, if you were an employee who worked from home, you could deduct your home office expenses as a miscellaneous itemized deduction on line 21 of Schedule A. Easy peasy.

That's no longer the rule. As a result of the Tax Cuts And Jobs Act (TCJA), for the tax years 2018 through 2025, you cannot deduct home office expenses if you are an employee."
 
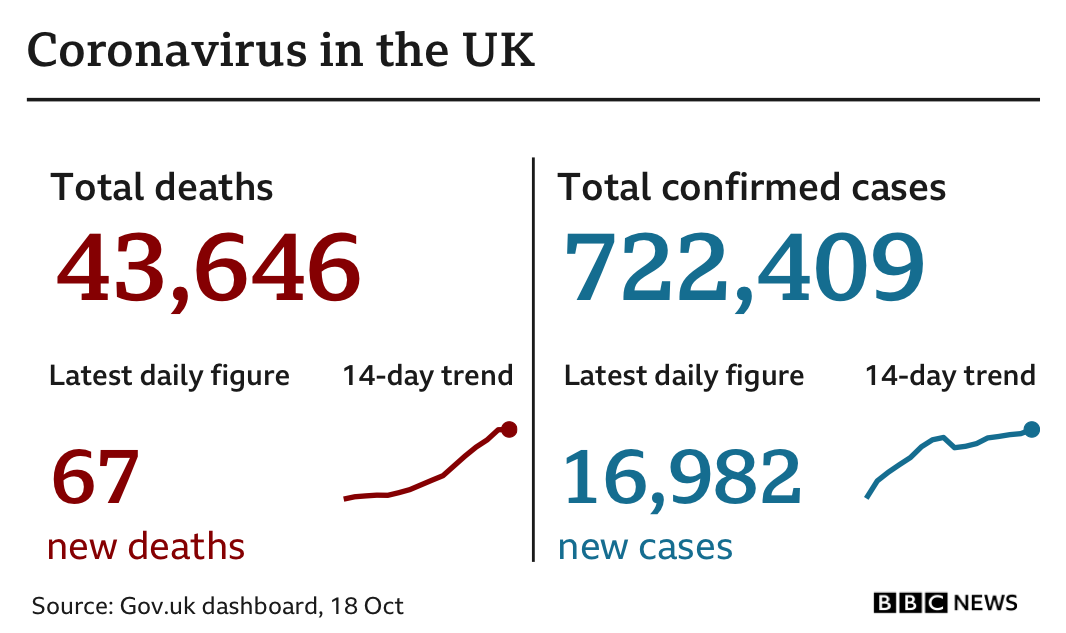
What needs to be looked at is the total deaths. They have fallen weekly over 80% since the end of July even though cases have increased. That shows a successful outcome if deaths decrease, because the cases will eventually come under control with the vaccine.

Also, why just the last 4 months? Look at the cases for the whole period from Mar to Oct (7 months) and I am sure more blue states would be in there (eg.NY, NJ,PE,MI,RI,MA,VT,OR,WA) This is just cherry picking a period of time to suit the writer's agenda IMO.

Again - why total deaths? Per capita deaths is what you want to look at. Total deaths isn't just cherry picking, it's meaningless unless you know the total population from which the deaths are coming.

Since deaths are reported by political jurisdictions that vary in size, it's virtually meaningless to compare total numbers from, say, India to those of Andorra.

Further, the next step is to locate the earliest death(s) per jurisdiction and then count the days out from that point (initial incidence date). Not every jurisdiction got CoVid at the same time. North Dakota, for example, doesn't appear in the top 15 per capita states for CoVid cases or deaths until almost exactly 2 months after Sturgis - because before that, they had almost no deaths.

Early on in the pandemic, major newspapers did employ techs to provide those graphs, but it has now grown too time consuming and public interest is waning, so we lost any ready ability to look at the data in that manner. Instead, most of us have to choose an arbitrary starting point for a series of comparison points.

It still says something way more than using "total deaths per jurisdiction."

For example, France's new cases as of yesterday were over 30,000 (but with a population slightly less than 1/5th of that of the US - so it would be like the US having 150,000 cases or a little more!)

UK has about 17,000 new cases today, with a population of almost exactly 1/5th of the US - so that would be like the US having 85,000.

If we look at total cases per capita (Worldometers uses per million, move one decimal point to compare to other data sources that use per 100,000), then North Dakota has the most cases of all the states, over all periods of time, not New York, California, or New Jersey"

1. North Dakota
2. Louisiana
3. South Dakota
4. Mississippi
5. Alabama
6. Florida
7. Iowa
8. Tennessee
9. Arkansas
10. Georgia
11. South Carolina
12. Arizona
13. Texas
14. Nebraska
15. Idaho

Seeing a pattern? We're now getting into states that are more ranged around the average deaths per capita in the US. Since you were trying to argue a point about politics, those are all red states.

Further, many of these states had their first infections well after the states you mentioned - but you decided not to do it per capita, which to me, is just raw data. We cannot compare the US to Andorra merely by total cases - or North Dakota to California. California has 40 million people. North Dakota has only 762,061/

California is over 40X bigger in terms of sample size. And comes in 30 out of 50 states in terms of the number of people who have been diagnosed with CoVid - California also has a good testing regimen and has had CoVid cases from February onward. Check out the testing rates for each of those states listed above - you'll see a pattern there too.

21. New York
24. New Jersey
30. California
34. Massachusetts

The charts you are trying to argue with aren't using total numbers of cases - but per capita cases, as that's the only valid technique of comparison. This same method is use throughout science for comparison.


wow... at first it sounded funny!! But its not.
Was it only June that we had clearer guidance? Do you mean the guidance to wear masks or something else?

masks, for sure, but other things as well... local state federal guidance, new tests, where to get tests, new symptoms, supplements to consider, A plethora of new information and guidance. And ever changing. Read the recently posted New England Journal of Medicine article above... additional something elses.
 
Here's a Forbes article that explains the change:

"In past years, if you were an employee who worked from home, you could deduct your home office expenses as a miscellaneous itemized deduction on line 21 of Schedule A. Easy peasy.

That's no longer the rule. As a result of the Tax Cuts And Jobs Act (TCJA), for the tax years 2018 through 2025, you cannot deduct home office expenses if you are an employee."

Yikes! Big Yikes.

Good thing I'm also self-employed. But that means I'm back to using Schedule C. I'll let you know if the IRS flags last year's tax returns.
 
Here's a Forbes article that explains the change:

"In past years, if you were an employee who worked from home, you could deduct your home office expenses as a miscellaneous itemized deduction on line 21 of Schedule A. Easy peasy.

That's no longer the rule. As a result of the Tax Cuts And Jobs Act (TCJA), for the tax years 2018 through 2025, you cannot deduct home office expenses if you are an employee."

Thanks much for posting... I knew I had seen something recently that was pretty good. I think it was this very article.....
throwpillow,36x36,750x1000-bg,f8f8f8.jpg
 
Crowds of the size in the photo qualify as "superspreaders" I think. A lot of members here have labeled much smaller gatherings as such. I could understand if they were standing a healthy distance apart but the photo shows them all crowded together.

I don't think just because they've done it for four years means it's safe to do this year. In my town, they've held a May Day parade for over 100 years but they didn't hold it this year although everyone promised to social distance.

I just think these types of large gatherings should be postponed until it's safer. When I go somewhere, I always wear a mask, but my glasses fog up. I also see others with fogged glasses, and that tells me that exhaled breath is escaping even though the masks are on.

When people are as close together as they were in the photo, it sure looks like a superspreader to me!

JMOO, of course.

The size of the crowd has nothing to do with whether the event is a superspreader. You can have 1 person at a family dinner spread to 20, who then spread to 200 in the next month - that's a superspreader event.

Or you can have a family dinner where no one gets CoVid, same size dinner, same number of people in the network.

Superspreading does not refer to the size of crowds. The positivity rate within the community is a crucial component. You could call a crowd a potential super-spreader event if it is without masks and in an area with high positivity (and all of these rallies vary in that - see my list of states with high rates of CoVId, in my post, just a few minutes ago).

I totally defer to your tax research, but you really ought not to redefine "superspreader" using how many people in a picture, that's not what it means.

Some human individuals, further, seem to have way more active virions exuding from their lungs than others. These are called super-spreaders, and they are at the core of the definition of the term. If a super spreader is recognized early and all their contacts are alerted, the spread can be kept to the average R-naught rate for that community - but that's a big IF and isn't happening in most of the US (or in Europe right now).

If the super-spreading individual is, further, asymptomatic and goes to work, gym, salon, school and church, well...the math will track a heckuva lot of cases back to that person.

I think we are up to 70 known individuals associated with the Rose Garden event (who are positive) with an additional 200 within federal employ in a range of 2 miles of the White House. Those have other places associated with them (Federal Architects Office, Capitol Hill Police). Maybe some day we'll know if there were individual superspreaders in this group (people intuitively began to blame Hope H because she was asymptomatic...)
 
I am looking at total deaths per state from the worldometers total death column. The top 10 states listed direct from WorldoM come to 148k deaths out of 225k, 109k blue states 39k red states in the top ten. CA has the third highest number of total deaths after NY and Texas.

I know you are. But that's not what was under discussion in the posts you were replying to and it makes no sense to do so.

You might as well just look at Planet Earth, as the data sources come from different populations, of different sizes.

In order to make your point, you must look at per capita data (go to the right of the death column, to the deaths per 1 million or, since you've picked cases, to the cases per million column - sort there).

THAT gives you the relative impact of Coronavirus per state in the US, as that's what you're trying to argue.

California has 40 million people (12% of Americans live and work there) so of course it has a lot of cases!

You must use per capita data to rank states or nations, not raw data. Sorry, it just doesn't work that way.
 
And I will requote MusicalJoke. ...which is No Joke.


I think if our current leadership had insisted (or even suggested) masking all the time, mandatory masking, etc, we would have the other half of the country refusing to do so just because it came from “the other side”. Either way, we would have half of the country not wanting to cooperate because of political garbage. It’s unfortunate.

It's sad to see such division. It didn't need to happen. Maybe in another time, that wouldn't have happened.

I guess in the end we can come together, to die together....


I think the problem lies (and has since the beginning) in the idea of "insisting." Since there was so much conflicting be thrown around early on, strong suggestions to wear masks, rather than mandates, would like have been more successful, JMOO.

We're still having large conflicts in information and in things like whether the death toll is accurate, inflated, or under-reported. I think it's going to be years before researchers are able to sort all of this out.

For example, my sister is a national Hospice nurse and she explained that many Hospice patients are being counted as Covid deaths--and most of the time they did test positive for Covid--but normally whatever put them on Hospice care to begin with would be counted. Such as CHF. Someone with advanced CHF would likely succumb to the flu, but the flu did not start the "chain of events" so (in normal times), the person would still be counted as a death from CHF. It's different now, because even if the person has CHF but tests positive for Covid, they will be counted as a Covid death.

Keep in mind that high number of Hospice patients have died and tested positive for Covid. But also remember that if they tested positive for the virus, they did not receive any treatment for it. When they entered Hospice, they agreed to only palliative care.

Because of that, I can see researchers in the next few years going back and changing the count based on the what started the "chain of events" as is the common way of recording the deaths of Hospice patients.
 
The size of the crowd has nothing to do with whether the event is a superspreader. You can have 1 person at a family dinner spread to 20, who then spread to 200 in the next month - that's a superspreader event.

Or you can have a family dinner where no one gets CoVid, same size dinner, same number of people in the network.

Superspreading does not refer to the size of crowds. The positivity rate within the community is a crucial component. You could call a crowd a potential super-spreader event if it is without masks and in an area with high positivity (and all of these rallies vary in that - see my list of states with high rates of CoVId, in my post, just a few minutes ago).

I totally defer to your tax research, but you really ought not to redefine "superspreader" using how many people in a picture, that's not what it means.

Some human individuals, further, seem to have way more active virions exuding from their lungs than others. These are called super-spreaders, and they are at the core of the definition of the term. If a super spreader is recognized early and all their contacts are alerted, the spread can be kept to the average R-naught rate for that community - but that's a big IF and isn't happening in most of the US (or in Europe right now).

If the super-spreading individual is, further, asymptomatic and goes to work, gym, salon, school and church, well...the math will track a heckuva lot of cases back to that person.

I think we are up to 70 known individuals associated with the Rose Garden event (who are positive) with an additional 200 within federal employ in a range of 2 miles of the White House. Those have other places associated with them (Federal Architects Office, Capitol Hill Police). Maybe some day we'll know if there were individual superspreaders in this group (people intuitively began to blame Hope H because she was asymptomatic...)


Okay, I better understand what you're saying now. We won't know if the gatherings were superspreaders unless we find out some who attended were likely the cause of spreading the virus.

I didn't really know there was a solid definition of the term because it's so new.
 
Again - why total deaths? Per capita deaths is what you want to look at. Total deaths isn't just cherry picking, it's meaningless unless you know the total population from which the deaths are coming.

Since deaths are reported by political jurisdictions that vary in size, it's virtually meaningless to compare total numbers from, say, India to those of Andorra.

Further, the next step is to locate the earliest death(s) per jurisdiction and then count the days out from that point (initial incidence date). Not every jurisdiction got CoVid at the same time. North Dakota, for example, doesn't appear in the top 15 per capita states for CoVid cases or deaths until almost exactly 2 months after Sturgis - because before that, they had almost no deaths.

Early on in the pandemic, major newspapers did employ techs to provide those graphs, but it has now grown too time consuming and public interest is waning, so we lost any ready ability to look at the data in that manner. Instead, most of us have to choose an arbitrary starting point for a series of comparison points.

It still says something way more than using "total deaths per jurisdiction."

For example, France's new cases as of yesterday were over 30,000 (but with a population slightly less than 1/5th of that of the US - so it would be like the US having 150,000 cases or a little more!)

UK has about 17,000 new cases today, with a population of almost exactly 1/5th of the US - so that would be like the US having 85,000.

If we look at total cases per capita (Worldometers uses per million, move one decimal point to compare to other data sources that use per 100,000), then North Dakota has the most cases of all the states, over all periods of time, not New York, California, or New Jersey"

1. North Dakota
2. Louisiana
3. South Dakota
4. Mississippi
5. Alabama
6. Florida
7. Iowa
8. Tennessee
9. Arkansas
10. Georgia
11. South Carolina
12. Arizona
13. Texas
14. Nebraska
15. Idaho

Seeing a pattern? We're now getting into states that are more ranged around the average deaths per capita in the US. Since you were trying to argue a point about politics, those are all red states.

Further, many of these states had their first infections well after the states you mentioned - but you decided not to do it per capita, which to me, is just raw data. We cannot compare the US to Andorra merely by total cases - or North Dakota to California. California has 40 million people. North Dakota has only 762,061/

California is over 40X bigger in terms of sample size. And comes in 30 out of 50 states in terms of the number of people who have been diagnosed with CoVid - California also has a good testing regimen and has had CoVid cases from February onward. Check out the testing rates for each of those states listed above - you'll see a pattern there too.

21. New York
24. New Jersey
30. California
34. Massachusetts

The charts you are trying to argue with aren't using total numbers of cases - but per capita cases, as that's the only valid technique of comparison. This same method is use throughout science for comparison.


Worldometers is what I linked and they show both for posters to compare. I am interested in the total deaths not deaths per million per state. It is total deaths that are in the news all the time and total cases. That's what we see in the charts too. The total weekly deaths are what I am following and they have fallen 80%. The deaths are falling while the cases are climbing, so that is what I am following.
 
Yikes! Big Yikes.

Good thing I'm also self-employed. But that means I'm back to using Schedule C. I'll let you know if the IRS flags last year's tax returns.

I am too and glad of it!

But, I wouldn't worry too much about last year's return, the IRS has been swamped and now, with Covid, I think they're even further behind. Plus, my accountant told me they're focusing on the 'Big Boys' now. I'm pretty much small peanuts.
 
Okay, I better understand what you're saying now. We won't know if the gatherings were superspreaders unless we find out some who attended were likely the cause of spreading the virus.

I didn't really know there was a solid definition of the term because it's so new.
Its a possible super spreader at the moment. It will be a good test of how effective masks are perhaps. The masked protesters at Bemidji had 4 cases out of 400, so 1%.
 
Massive WHO remdesivir study suggests no Covid-19 benefit. Doctors aren't so sure.

The new study — which included data from more than 11,200 people in 30 countries — is the result of the World Health Organization's Solidarity trial. It was published online Thursday on the preprint server medRxiv, meaning it has not been peer-reviewed.


Dr. Andre Kalil, a principal investigator for the NIH trial at the University of Nebraska Medical Center in Omaha, said the Solidarity trial lacked some of the basics critical to scientific research: "No data monitoring, no placebo, no double-blinding, no diagnostic confirmation of infection."

"Poor-quality study design cannot be fixed by a large sample size, no matter how large it is," Kalil told NBC News.

Massive WHO remdesivir study suggests no Covid-19 benefit. Doctors aren't so sure.

I do believe doctors should continue to watch and learn, but your bolded statement is not what I thought was the main information. We do benefit to know there is more to know about the research as we go along. I see no doctor removing Remdesivir for a while.......

THIS is what was most important to me:
BECAUSE we have learned so much more about the inflammatory disease process being the deadly results of Covid---We have to keep ruling in and ruling out drugs....

That inflammatory process, rather than the acute viral infection, is responsible for the more severe consequences of Covid-19. In theory, once that inflammation has taken over, an antiviral drug to reduce the amount of virus in the body would be minimally effective, at best.

"It's reasonable to expect that an antiviral has diminishing returns," said Cameron Wolfe, an infectious diseases expert and an associate professor of medicine at Duke University School of Medicine. People infected with Covid-19 generally go through an i
 
Last edited:
Covid-19 in the UK: How many coronavirus cases are there in your area?


There have been more than 700,000 confirmed cases of coronavirus so far in the UK and more than 40,000 people have died, government figures show.

However, these figures include only people who have died within 28 days of testing positive for coronavirus and other measures suggest the number of deaths is higher.

_114958596_uk_card_18oct-nc.png

_105914179_blank_white_space-nc.png

_114952585_uk_hosp_card_17oct-nc.png


Hospital admissions vary around the UK
The latest figures show hospital admission rates for Covid-19 patients rising most quickly in the North West and the North East and Yorkshire region.

With rising Covid-19 admissions, there have been warnings that hospitals will have to cut back core services.

_114958602_optimised-uk_regions_hospital_admissions_facet_18october-nc.png
 
Last edited:
I think the problem lies (and has since the beginning) in the idea of "insisting." Since there was so much conflicting be thrown around early on, strong suggestions to wear masks, rather than mandates, would like have been more successful, JMOO.

We're still having large conflicts in information and in things like whether the death toll is accurate, inflated, or under-reported. I think it's going to be years before researchers are able to sort all of this out.

For example, my sister is a national Hospice nurse and she explained that many Hospice patients are being counted as Covid deaths--and most of the time they did test positive for Covid--but normally whatever put them on Hospice care to begin with would be counted. Such as CHF. Someone with advanced CHF would likely succumb to the flu, but the flu did not start the "chain of events" so (in normal times), the person would still be counted as a death from CHF. It's different now, because even if the person has CHF but tests positive for Covid, they will be counted as a Covid death.

Keep in mind that high number of Hospice patients have died and tested positive for Covid. But also remember that if they tested positive for the virus, they did not receive any treatment for it. When they entered Hospice, they agreed to only palliative care.

Because of that, I can see researchers in the next few years going back and changing the count based on the what started the "chain of events" as is the common way of recording the deaths of Hospice patients.
When my aunt died last year, she had CHF and was a diabetic. Both were under control and she was not in hospice.
She got the flu from her home health aide and it was counted as a flu death. The flu caused the calvacade of health issues which she did not have prior to the flu.
Something to add to my list to ask the nurse or coding.
 
Massive WHO remdesivir study suggests no Covid-19 benefit. Doctors aren't so sure.

The new study — which included data from more than 11,200 people in 30 countries — is the result of the World Health Organization's Solidarity trial. It was published online Thursday on the preprint server medRxiv, meaning it has not been peer-reviewed.


Dr. Andre Kalil, a principal investigator for the NIH trial at the University of Nebraska Medical Center in Omaha, said the Solidarity trial lacked some of the basics critical to scientific research: "No data monitoring, no placebo, no double-blinding, no diagnostic confirmation of infection."

"Poor-quality study design cannot be fixed by a large sample size, no matter how large it is," Kalil told NBC News.

Massive WHO remdesivir study suggests no Covid-19 benefit. Doctors aren't so sure.
This is a much larger study than the NEJM one. We will have to see what WHO and the approval authorities in the various countries do next.
 
Status
Not open for further replies.

Members online

Online statistics

Members online
182
Guests online
3,919
Total visitors
4,101

Forum statistics

Threads
591,827
Messages
17,959,683
Members
228,621
Latest member
MaryEllen77
Back
Top